
European Markets Opened October in the Red. Blame the Bond Market.

European stocks bond yields moved sharply in opposite directions as October began, with the pan-European STOXX 600 index falling 1% to 628.1 points, its lowest level since mid-September. The decline came as global bond yields surged to multi-decade highs, with the US 10-year Treasury yield touching 5.3168%.

A Rough Start to the Fourth Quarter

Banks led the losses across most European sub-sectors, a sign that investors are repricing financial stocks as borrowing costs climb rather than treating higher yields as a straightforward win for lenders. The move extended a pattern that had already defined much of September, when global yields climbed steadily as investors sold government debt.

The sell-off reflects a market trying to digest several forces at once: higher interest rate expectations, persistent inflation concerns tied to energy costs, and continued strength in AI-related investment that is reinforcing broader growth expectations even as rate-sensitive sectors wobble, according to market data reported by Reuters via Investing.com.

Why European Stocks Bond Yields Losses Are Linked

When bond yields rise this fast, equity investors typically respond in two ways: they demand higher returns from stocks to compensate for safer government debt now paying more, and they reassess which sectors can actually pass higher input costs through to customers. Banks sit in an unusual position here, since higher rates can boost lending margins over time but also raise the risk of loan defaults and dampen demand for new borrowing in the short term, which appears to be the dynamic currently weighing on the sector.

The “higher for longer” narrative around interest rates has gained traction as investors price in the possibility that central banks will be slower to cut rates than markets had hoped earlier in the year, adding further pressure on yield-sensitive stocks.

European stocks bond yields

Insurance and real estate stocks, which tend to be similarly sensitive to borrowing costs, also featured among the session’s weaker performers, reinforcing that this was a broad rate-driven move rather than a problem isolated to banks alone. Defensive sectors less exposed to interest rate swings held up comparatively better, a typical pattern when markets reprice around rate expectations rather than reacting to a specific company or industry shock.

Banks Lead the Declines

One notable individual mover was UK-based Gamma Communications, which fell roughly 3% after Dutch private equity firm Waterland withdrew its takeover bid, a reminder that company-specific M&A news can still move share prices sharply even amid a broader macro-driven sell-off. That kind of deal withdrawal often signals that acquirers are growing more cautious about valuations in a higher-rate environment, since the cost of financing a buyout rises alongside benchmark yields.

Eurozone unemployment data due later in the session added another variable investors were watching closely, since a weaker labor market reading could complicate the European Central Bank’s own rate path at a moment when inflation concerns are already running high.

Oil Prices Tell a Different Story

Crude oil prices moved in the opposite direction, falling below $100 per barrel as Gulf exports recovered and US inventories posted a surprise increase. That divergence, falling oil alongside rising bond yields, complicates the simple inflation narrative that typically links higher energy costs directly to higher rates, suggesting supply-side factors are currently doing more to move oil prices than the same inflationary pressures hitting bond markets.

For investors trying to read the overall picture, the combination of falling oil and rising yields suggests markets are pricing in persistent rate pressure even without an acute energy-driven inflation shock behind it.

What Investors Are Watching Next

The key signal to watch in the coming weeks is whether the 10-year Treasury yield stabilizes near its current multi-decade high or continues climbing, since further increases would likely extend pressure on European equities, particularly rate-sensitive sectors like banking and real estate. Eurozone inflation and unemployment data will also shape how quickly the European Central Bank is willing to move on rates from here.

Markets heading into the fourth quarter are effectively testing whether strong AI-driven growth expectations can offset the drag from higher borrowing costs, or whether yields climbing further would eventually outweigh that optimism.

Currency markets are another indicator worth watching alongside equities and bonds. A sustained rise in US Treasury yields typically strengthens the dollar relative to the euro and pound, which can complicate the picture further for European exporters already contending with higher domestic borrowing costs.

European Markets: Quick Answers

How much did the STOXX 600 fall?
About 1%, to 628.1 points, its lowest level since mid-September.

How high did the US 10-year Treasury yield climb?
To 5.3168%, described as a multi-decade peak.

Which sector led the declines?
Banks, across most European sub-sectors.

What happened to oil prices?
Crude fell below $100 per barrel on recovering Gulf exports and a surprise rise in US inventories.

What company saw a notable individual drop?
UK-based Gamma Communications fell about 3% after Waterland withdrew its takeover bid.

Related Coverage on Tamara News

For related market coverage, see our reporting on Treasury yields ending September at multi-year highs and the S&P 500’s record highs despite climbing bond yields.

Sources

German Inflation Rises Ahead of the ECB’s October Meeting

In this article

German inflation looks set to have picked up in September, which raises the stakes for the European Central Bank’s next policy meeting on 28–29 October 2026. Five German states reported higher September inflation on 30 September, and the national figure is due this week.

What the numbers show

Germany’s statistics office, Destatis, put August inflation at 2.9% year on year, with prices up 0.2% on the month. Core inflation, which excludes food and energy, was 2.4%. Energy was the main driver: energy prices rose 10.5% over the year in August, up from 8.3% in July and 3.4% in June. Food prices were almost flat at 0.1%. Destatis said final August results would follow on 10 September.

September signals

A Europe Intelligence Brief citing Reuters lists September state-level readings of 3.2% in Bavaria, 3.3% in North Rhine-Westphalia and Lower Saxony, 2.9% in Baden-Württemberg and 3.4% in Hesse. The same brief says economists expect the national harmonised rate at 3.2%, up from 2.9% in August. These are forecasts and regional prints, not the official national number, so wait for Destatis before drawing firm conclusions.

The ECB’s October meeting

The ECB’s official calendar shows a monetary policy meeting on 28–29 October 2026, with a press conference after the second day. A market-analysis site, Admiral Markets, says the deposit rate stands at 2.50% and that futures pricing on 24 September implied roughly a 60% chance of a rise to 2.75%, citing ECB Watch data. Market-implied odds move daily and are not an ECB forecast. Bundesbank President Joachim Nagel has said rates could enter “mildly restrictive territory” if energy pressures persist, per the same source. Related reading: Treasury yields at the end of September and this week’s key economic data.

What it means for businesses

Consider a Brazilian founder who imports machinery components from Germany and borrows in euros. Higher German inflation can push the ECB toward higher borrowing costs and a firmer euro, both of which affect landed costs and loan repayments. That is an illustration, not a forecast. Companies with euro exposure usually review hedging and supplier pricing ahead of central bank meetings. If you are comparing jurisdictions for a business, see our company formation guide.

Questions readers ask

What was German inflation in August 2026?

Destatis reported 2.9% year on year, with core inflation at 2.4% and energy prices up 10.5%.

When does the ECB next decide on interest rates?

The Governing Council meets on 28–29 October 2026, per the ECB’s calendar.

Will the ECB raise rates in October?

Nobody knows yet. A market-analysis site cited futures pricing implying roughly a 60% chance of a rise on 24 September, but those odds change daily.

Why is energy driving inflation?

Destatis data show energy prices rising 10.5% year on year in August, the biggest contributor to the headline rate.

Where can I find the official September figure?

Destatis publishes the national consumer price release on its press page this week.

A $111 Billion Media Merger Just Cleared Its Last Legal Hurdle

The Paramount Warner Bros merger cleared its final legal obstacle on September 30, 2026, when US District Judge Araceli Martinez-Olguin approved a settlement resolving the antitrust dispute that had threatened to delay the deal. Paramount Skydance is now aiming to close the $111 billion acquisition of Warner Bros. Discovery by October 6.

The Settlement That Unlocked a $111 Billion Deal

Judge Martinez-Olguin described the negotiated settlement as reflecting “a procedurally sound resolution” of the legal challenge, according to the Washington Examiner’s report on the ruling. The litigation had centered on antitrust concerns raised by state attorneys general, with California’s involvement drawing particular attention given the concentration of media and entertainment assets the combined company would control.

Neither company has published the settlement’s specific terms in full, but the approval itself is the signal markets were waiting for: without it, the merger’s October 6 closing target would have been at serious risk of slipping into further litigation.

Inside the Paramount Warner Bros Merger Timeline

This deal has moved through an unusually long regulatory gauntlet for an entertainment-sector merger of this size, reflecting how much consolidation Hollywood and the broader media industry have already absorbed in recent years. A combined Paramount Skydance and Warner Bros. Discovery would bring together two of the industry’s deepest film and television libraries, along with overlapping streaming, cable and studio operations that regulators scrutinized closely before this settlement.

The $111 billion price tag makes this one of the largest media transactions in years, and its progress has been watched as a bellwether for whether regulators will keep approving large media consolidations or start drawing firmer lines, as reflected in related coverage from the Washington Times.

Skydance’s involvement traces back to its own earlier acquisition of Paramount, a deal that itself drew scrutiny before closing and reshaped the company’s leadership and strategic direction. Combining that newly formed Paramount Skydance with Warner Bros. Discovery effectively stacks one major consolidation on top of another within the space of a couple of years, a pace of change that is unusual even by Hollywood’s recent standards.

Paramount Warner Bros merger

What the States Were Fighting Over

State attorneys general who challenged the deal were primarily concerned with market concentration: how much control one company should have over film production, cable distribution and streaming simultaneously. Settlements of this kind typically involve commitments around content licensing, carriage terms, or divestitures designed to preserve some competitive pressure even after the merger closes, though the full conditions attached to this approval have not been detailed publicly.

For consumers, the more concentrated ownership structure raises familiar questions about pricing power across streaming subscriptions and cable bundles, questions that tend to surface only well after a deal like this has already closed and the combined company starts setting its own terms.

Settlements in large media mergers often also touch on how much access smaller distributors and independent content producers retain once a deal closes, since concentrated ownership can give the combined company outsized leverage in licensing negotiations. Regulators weighing approval typically balance that risk against the argument that larger, better-capitalized media companies are better positioned to compete against streaming giants that already operate at global scale.

What Happens After the Deal Closes

If Paramount Skydance meets its October 6 target, the next phase will be operational integration: combining executive teams, rationalizing overlapping streaming platforms, and deciding which studio brands survive as standalone labels versus which get folded into a single identity. Deals this large rarely integrate smoothly or quickly, and investors will be watching early guidance on cost synergies and content strategy as the clearest signal of how the combined company plans to compete against Netflix, Disney and Amazon.

Regulators in other jurisdictions, including international markets where both companies operate, may still have their own approval processes to complete even after this US settlement, so an October 6 close in the US does not necessarily mean every piece of the global transaction wraps up on the same date.

Employees at both companies are likely facing the most immediate uncertainty. Mergers of this scale typically involve some workforce reduction as overlapping departments, from marketing to legal to distribution, get consolidated into single teams. How aggressively Paramount Skydance pursues those cuts, and how quickly, will shape perception of the deal’s early success independent of its financial performance.

Paramount-Warner Merger: Key Questions

What did the judge approve?
A settlement resolving the antitrust litigation that had challenged the merger, clearing the way for it to proceed.

How much is the deal worth?
$111 billion.

When is the deal expected to close?
Paramount Skydance is targeting October 6, 2026.

Which states were involved in the legal challenge?
California was a central party, among other states that raised antitrust concerns.

What companies are merging?
Paramount Skydance and Warner Bros. Discovery.

Related Coverage on Tamara News

For more on how markets are reacting to major corporate moves this week, see our coverage of AMD joining the trillion-dollar market cap club and Northern Star’s rejected takeover bid from Gold Fields.

Sources

Treasury Yields End September: 10-Year at 5.26%

U.S. Treasury yields ended September at levels that keep borrowing costs high around the world. The Treasury Department’s daily par yield curve shows the 10-year note at 5.26% on 29 September 2026, the 30-year at 5.59% and the 2-year at 4.89%, based on Treasury’s published rates. The day before, the 10-year closed at 5.24% and the 30-year at 5.56%. These Treasury yields matter because they act as a benchmark for dollar borrowing.

Contents

The numbers on the last trading days

According to Treasury’s table, the 2-year yield slipped from 4.92% on 28 September to 4.89% on 29 September, while the 10-year rose from 5.24% to 5.26% and the 30-year from 5.56% to 5.59%. Long-dated yields edged up as short-dated yields edged down, so the gap between the 2-year and 10-year widened slightly to 37 basis points.

Weekly market data compiled by TradingKey, a market-analysis site, says the 10-year yield touched 5.225% during the week of 21-27 September before closing near 5.17%, and that Brent crude fell below $98 a barrel. Treat those as a secondary-source snapshot; the Treasury table above is the primary record. For the stock-market side of the same week, see our note on S&P 500 record highs alongside rising yields.

The Fed’s September hike

The backdrop is the Federal Reserve’s 16 September decision. The Federal Open Market Committee voted 12-0 to raise its target range by a quarter point to 3.75%-4.00%. In its policy statement, the Committee said inflation “remains elevated” and that the move would support a timelier return to its 2 percent goal, while describing economic activity as expanding at a solid pace. CNBC had reported on 14 September that the 10-year yield hit 5% before reversing as traders awaited the meeting, so yields have moved higher since.

How it reaches borrowers abroad

Consider a hypothetical Brazilian founder who raised a dollar-denominated loan last year. This is an illustration, not a reported case. If that loan resets against a dollar benchmark, higher U.S. rates raise the interest bill, and converting reais into dollars to repay it adds currency risk on top. The same logic applies to governments and companies that issue dollar bonds, and to exporters whose customers finance purchases in dollars. The effect varies by contract, so anyone exposed should read their own loan terms rather than rely on the headline yield.

Data that could move yields next

The coming week is crowded with releases. Our week-ahead economic calendar sets out the scheduled reports, and our coverage of Micron’s results shows how technology earnings are feeding the equity side. Surprises in jobs or inflation data are the usual catalysts for sharp moves in the 10-year yield.

Quick answers

What was the 10-year Treasury yield on 29 September 2026?

The U.S. Treasury’s daily par yield curve shows 5.26%, up from 5.24% on 28 September. The 2-year was 4.89% and the 30-year 5.59%.

What did the Federal Reserve do on 16 September?

The FOMC voted 12-0 to raise the federal funds target range by 0.25 percentage points to 3.75%-4.00%, according to its statement.

Why do Treasury yields matter outside the United States?

Dollar yields are a benchmark for global borrowing. When they rise, dollar-denominated loans and bonds generally cost more to issue or refinance, including for companies and governments outside the U.S.

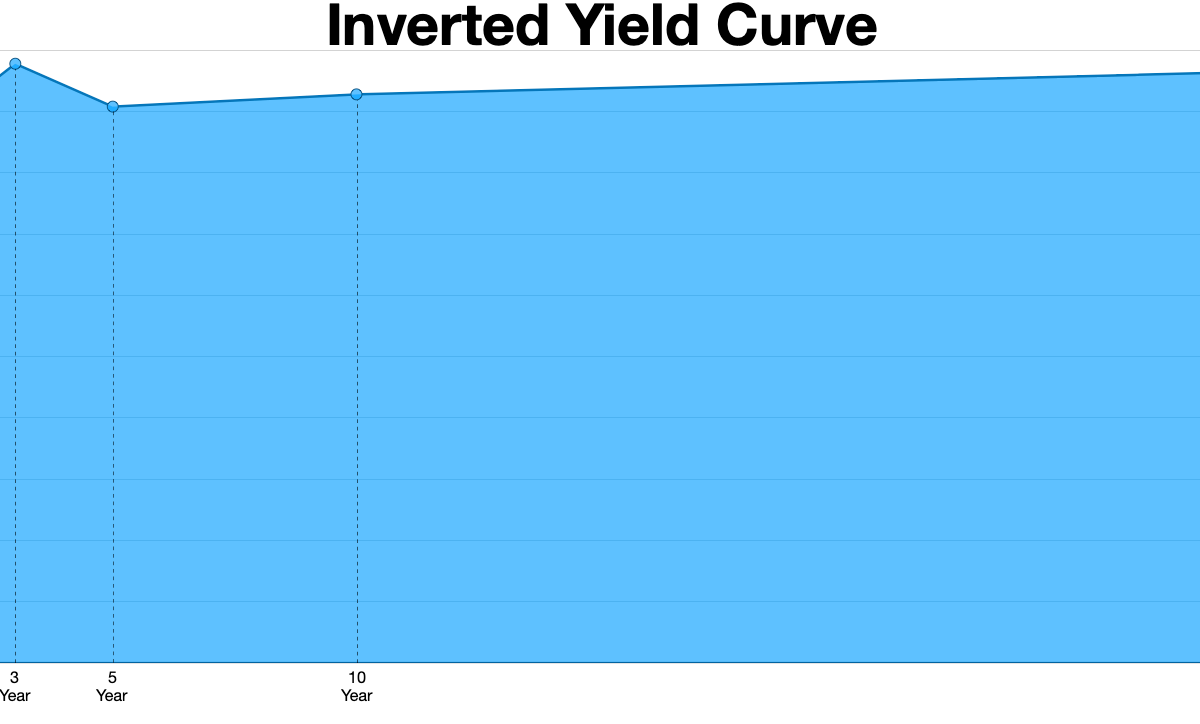
Is a yield curve with 10-year above 2-year inverted?

No. On 29 September the 10-year yield (5.26%) was above the 2-year yield (4.89%), which is a normal upward-sloping shape.

Where can I check the latest yields myself?

The U.S. Treasury publishes the daily par yield curve rates on its website, and the Federal Reserve publishes the H.15 selected interest rates release.

Wall Street Thinks Micron Is About to Prove a Point

Micron Technology reports its fiscal fourth-quarter and full-year 2026 results today. The numbers will be read as a referendum on the AI boom. Specifically, how much of that boom is reaching the companies that make the memory chips underneath it. The Micron Q4 earnings release is scheduled for September 30, 2026. It comes after a year in which memory prices and demand both climbed sharply on the back of AI infrastructure spending.

Analysts at JPMorgan have positioned Micron for what 24/7 Wall St. described as a “beat-and-raise” quarter. That means both current results and forward guidance are expected to top prior estimates.

Why this Micron Q4 earnings report matters more than usual

Micron makes DRAM and NAND memory chips, along with high-bandwidth memory used in AI accelerators. Demand for that high-bandwidth memory has surged as AI companies build out data centers. Coverage from The Motley Fool notes that available production capacity across the memory industry has effectively been presold. That is unusual for a sector that has historically moved through sharp boom-and-bust price cycles.

The scale of the underlying spending helps explain why. Data center capital spending is estimated to rise from roughly $800 billion in 2026 to $1.3 trillion in 2027. Some Wall Street estimates cited by The Motley Fool put the figure as high as $3 trillion to $4 trillion by 2030. If those projections hold even loosely, memory demand tied to AI infrastructure looks more like a structural shift. It would not be just a temporary spike.

Close-up of a circuit board representing Micron Q4 earnings and memory chip demand

How the stock is priced heading into the report

Despite the bullish demand backdrop, Micron shares trade at roughly 6.8 times projected fiscal 2027 earnings. That is according to The Motley Fool’s analysis. Such a multiple would typically suggest the market expects a downturn rather than sustained growth. That gap between the stock’s valuation and the demand story is part of why today’s guidance carries extra weight. A strong outlook could force investors to reassess how durable this cycle really is.

What to watch in today’s numbers

Investors are expected to focus on several things beyond the headline revenue and earnings-per-share figures. Those include high-bandwidth memory revenue specifically, pricing trends across DRAM and NAND, and management commentary on capacity already locked in with AI chipmakers and cloud providers. Guidance for the first quarter of fiscal 2027 will matter as much as the quarter just reported.

What to watch when Micron reports

Results are due after markets close, with a call for analysts to follow. So much of Micron’s near-term capacity is already spoken for. That means the more consequential number may not be this quarter’s revenue. It may instead be management’s tone on how long the current pricing environment can hold. Investors will also listen for any sign that customers plan to pull back on committed orders.

The bigger picture for chipmakers

Micron’s results will also be read alongside other memory and equipment makers reporting around the same period, including ASML. A strong report from Micron would reinforce a broader narrative. AI infrastructure spending is flowing all the way down to component suppliers, not just to the AI labs and cloud giants at the top of the chain.

That dynamic also shapes how investors should read Micron’s results relative to its peers. South Korean rivals SK Hynix and Samsung compete directly in the high-bandwidth memory market. Any commentary Micron offers about pricing power or capacity constraints will inevitably be compared against how those competitors describe the same demand environment. A consistent message across all three companies, that capacity is effectively sold out well in advance, would carry more weight than any single company’s results alone.

How AI chipmakers and memory suppliers fit together

Memory chips do not compete directly with the AI accelerators made by companies like Nvidia and AMD. But the two categories are tightly linked. Every new generation of AI accelerator requires more high-bandwidth memory to function. That means memory suppliers benefit from the same spending cycle driving demand for the chips that do the actual AI computation. This relationship is part of why Micron’s results are often treated as a leading indicator for AI infrastructure spending more broadly, even though Micron itself does not build the processors that power large AI models.

Common questions about the Micron earnings report

When did Micron report its fiscal Q4 2026 results?

Micron scheduled its results for September 30, 2026, after markets closed. That is according to the company’s own investor announcement.

Why do analysts expect a strong quarter from Micron?

JPMorgan analysts positioned Micron for a beat-and-raise quarter. Reporting from The Motley Fool notes that available memory production capacity has effectively been presold due to AI-driven demand.

What is high-bandwidth memory and why does it matter here?

High-bandwidth memory, or HBM, is a type of memory chip used alongside AI accelerators to move data faster. Demand for HBM has been a major driver of memory chip revenue as AI infrastructure spending has grown.

Is Micron’s stock expensive right now?

According to The Motley Fool, Micron trades at about 6.8 times projected fiscal 2027 earnings. That is a relatively low multiple, suggesting the market has not fully priced in sustained AI-driven demand.

How large is data center spending expected to grow?

The Motley Fool cites estimates putting global data center capital spending at roughly $800 billion in 2026. That figure could rise to $1.3 trillion in 2027 and $3 trillion to $4 trillion by 2030.

More AI and business coverage

Sourcing

  • The Motley Fool — Sept. 30 Could Be the Start of a New Paradigm for Micron. fool.com
  • GlobeNewswire — Micron Technology to Report Fiscal Fourth Quarter Results on September 30, 2026. globenewswire.com