

AMD Just Joined an Exclusive Club. Wall Street Isn’t Fully Sold.

AMD shares have surged 188% since the start of 2026. That rally pushed the chipmaker’s AMD trillion market cap milestone into view in late September, placing it alongside a small group of companies worth more than $1 trillion. The stock is up roughly 292% over the past twelve months, according to 24/7 Wall St.

The move puts AMD in rare company among chipmakers. Only a handful of semiconductor firms have ever reached that valuation, and AMD’s climb happened faster than most.

What’s behind the AMD trillion market cap milestone

Data center growth is the main driver. AMD’s second-quarter revenue jumped 50% year over year to $11.5 billion. Data center revenue alone grew 107% to $6.7 billion, now 58% of the company’s total sales. CEO Lisa Su described the company as being “in the early innings of a multi-year AI adoption cycle.”

Anchor customers are backing that growth. OpenAI, Meta, and Anthropic have all signed commitments representing significant GPU demand. AMD has guided for its 2027 data center segment revenue to more than double from current levels.

Close-up of a computer processor board, symbolizing the chip demand behind the AMD trillion market cap milestone

Why some analysts remain cautious

Not everyone on Wall Street is convinced the rally has more room to run. 24/7 Wall St. rates AMD a hold, with a price target of $521.81, which implies roughly 14% downside from recent levels. The firm’s math is stark: AMD trades at 232 times trailing earnings, versus about 46 times for Nvidia.

Other concerns include a forward multiple of 105 times earnings, which leaves little room for error if growth slows, according to Benzinga. Gaming revenue fell 31% year over year, a reminder that not every part of AMD’s business is booming. US export restrictions on the Instinct MI308 chip have also forced inventory charges tied to sales that cannot go through.

The bull case for AMD’s next chapter

Supporters of the stock point to the size of the opportunity ahead. The data center AI accelerator market could reach $1.4 trillion by 2030, based on estimates cited in the same 24/7 Wall St. analysis. If AMD keeps its current share of that market, the AMD trillion market cap milestone could look conservative in hindsight rather than a peak.

What happens next for AMD stock

Investors will watch whether AMD’s data center guidance holds up when the company next reports earnings. Any sign that OpenAI, Meta, or Anthropic are pulling back their commitments would test the stock’s valuation quickly. So would a fresh round of export restrictions affecting AMD’s chip sales to China.

AMD’s rally, in five questions

When did AMD reach a $1 trillion market cap?

AMD crossed the $1 trillion market cap threshold in late September 2026, following a 188% year-to-date share price gain.

What is driving AMD’s stock rally?

Data center revenue tied to AI accelerators is the main driver, with second-quarter data center revenue up 107% year over year and commitments from OpenAI, Meta, and Anthropic.

Do analysts think AMD stock will keep rising?

Views are mixed. 24/7 Wall St. rates the stock a hold, citing a valuation of 232 times trailing earnings, well above Nvidia’s roughly 46 times.

What risks does AMD face?

Key risks include a 31% year-over-year decline in gaming revenue, a high forward earnings multiple, and US export restrictions affecting chip sales to China.

How big could the AI chip market become?

Some estimates cited by 24/7 Wall St. put the data center AI accelerator market at $1.4 trillion by 2030, up sharply from current levels.

Further reading on Tamara News

For more on the chip industry, see our coverage of the Nvidia chip export loophole to China, the pushback on data center tax breaks, and the delay to Oracle’s Project Jupiter.
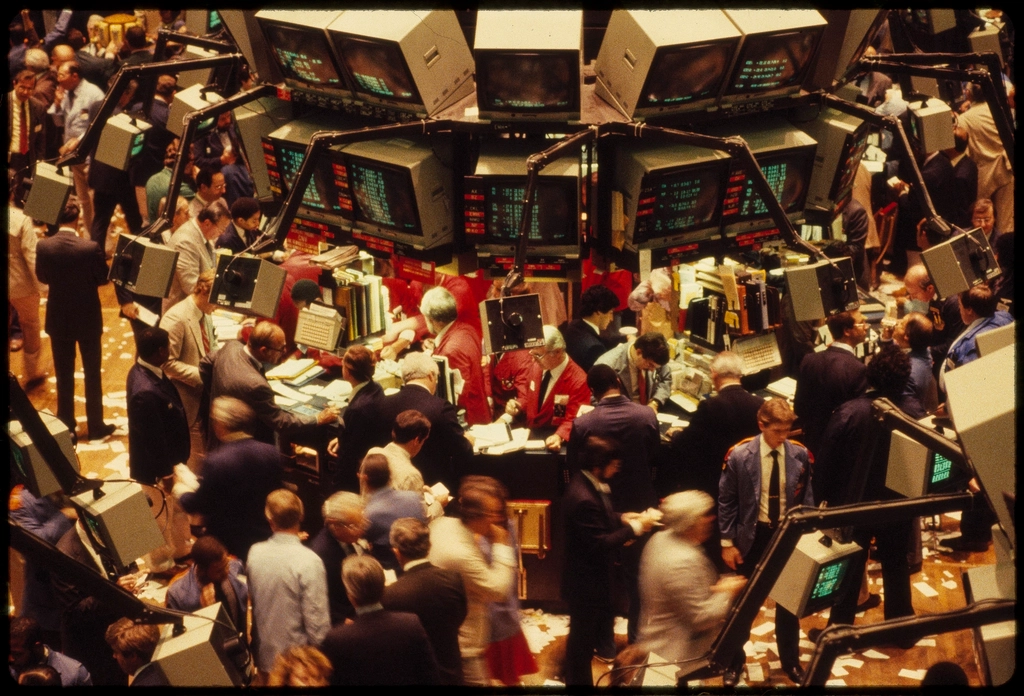

Four Numbers This Week Could Decide Where Stocks Go Next

Markets face a dense stretch of numbers between September 28 and October 2, 2026. The week ahead economic data lineup includes an inflation report the Federal Reserve watches closely. It also includes a jobs report due Friday, and earnings from two closely watched companies. Any one of these could move stocks, depending on how far it strays from expectations.

Here is what is scheduled, why it matters, and what a surprise in either direction could mean for the days ahead.

Tuesday: an early read on jobs and confidence

JOLTS job openings data and the Conference Board’s Consumer Confidence Index arrive on Tuesday, September 29. Both offer an early signal on labor conditions and household sentiment ahead of Friday’s bigger jobs report. Neither typically moves markets as much as the payrolls number. Still, a sharp move in either can shift expectations for the rest of the week.

Wednesday: the week ahead economic data centerpiece

Wednesday brings the ADP employment report and the Personal Consumption Expenditures price index, known as the PCE. The PCE is the Federal Reserve’s preferred inflation gauge. It currently sits at 3.3% year over year, well above the Fed’s 2% target. A hotter-than-expected reading could push interest-rate expectations higher and pressure growth stocks. A cooler number could ease those worries.

Micron also reports earnings Wednesday. Investors will watch its data center and high-bandwidth memory business closely. That segment has become a proxy for demand in AI chips more broadly, as tracked by TradingView’s earnings calendar.

US Capitol dome, representing the policy backdrop for this week's week ahead economic data

Thursday and Friday: manufacturing, claims, and the jobs report

The ISM Manufacturing PMI and weekly jobless claims land on Thursday, October 1. Both give a read on industrial strength and layoff trends. Nike also reports earnings that day, a number often treated as a gauge of consumer spending resilience.

Friday, October 2, brings the week’s biggest release: the September jobs report. August’s reading showed 162,000 jobs added and a 4.1% unemployment rate. Economists will compare September’s number against that baseline to judge whether the labor market is cooling or holding steady.

Why this week ahead economic data matters for the Fed

The Federal Reserve raised its benchmark rate to a range of 3.75% to 4.00% earlier in September. That was its first hike of this size since 2023, according to CNBC. Inflation and jobs data released this week will shape expectations for the Fed’s next move. Policymakers weigh both sides of their mandate: price stability and employment.

A jobs report that beats expectations, paired with sticky inflation, would make further tightening more likely. A weak jobs number could shift the conversation toward when the Fed might ease instead.

What to watch once the data lands

Traders will react first to Wednesday’s PCE print and Friday’s payrolls number. Those two carry the most weight for Fed policy. Micron and Nike’s results will matter more for their own sectors than for the broader market. Expect volatility to pick up as each release lands, then settle once traders have digested the numbers.

What people want to know this week

What is the most important economic report this week?

The September jobs report on Friday, October 2, typically draws the most attention, alongside the PCE inflation report on Wednesday, September 30.

Why does the PCE matter so much to markets?

The PCE price index is the Federal Reserve’s preferred inflation gauge. It currently runs at 3.3% year over year, above the Fed’s 2% target, so any surprise in either direction can shift rate expectations.

Which companies report earnings this week?

Micron reports Wednesday, October 1, with results seen as a signal for AI chip and memory demand. Nike reports Thursday, viewed as a gauge of consumer spending.

What was August’s jobs report?

August showed 162,000 jobs added and a 4.1% unemployment rate. That is the baseline economists will compare September’s report against.

Where does the Fed’s interest rate stand right now?

The Federal Reserve raised its benchmark rate to a range of 3.75% to 4.00% in mid-September 2026, its first hike of that size since 2023.

More markets coverage from Tamara News

For more markets coverage, see our reports on the S&P 500’s record highs, the recent Treasury yields bond rout, and last week’s stock market weekly gains.

The S&P 500 Keeps Hitting Records Even as Bond Yields Climb

The S&P 500 gained 1.2% over the week ending September 26, 2026, closing roughly 0.7% below its all-time high even as a fresh surge in 10-year Treasury yields failed to derail the advance. The resilience is notable given how directly rising yields typically pressure equity valuations, and it points to a market still willing to reward growth-oriented sectors even as the cost of borrowing climbs.

What drove the week’s gains

Large-cap growth stocks led the advance, with the “Mag 7” and broader technology sector outperforming, while smaller companies, real estate investment trusts and commodities lagged, according to market data summarized in weekly coverage of the session. Growth stocks substantially outperformed value stocks over the period — an unusual pattern to see alongside rising rates, since higher yields typically weigh more heavily on the long-duration cash flows growth companies are priced on, not less.

27 record closes and counting

This week’s move extends a pattern that has defined 2026: the S&P 500 had already closed at all-time highs 27 times through August 26, 2026, part of a year-to-date gain of roughly 13%, according to Yahoo Finance’s analysis of the index’s performance. Historical data spanning January 1988 through December 2023 shows that in the 12 months following a record close, the S&P 500 has averaged a 13.4% gain — compared with an 11.9% average across all 12-month periods — leading the analysis to note that “it has historically been better to buy after a record close than to buy stocks on the average day.”

The risks investors are still watching

The same analysis flags several headwinds that could yet interrupt the streak: the ongoing Iran conflict, elevated 30-year Treasury yields, and the possibility of further Federal Reserve interest rate increases. None of these guarantee an imminent correction, but they are cited as the main reasons record highs are not being treated as an unambiguous green light by every market participant. One analyst tracking the week’s action said they remain invested but are “gradually increasing cash reserves to hedge against a potential market correction” — a hedge-while-still-participating posture that seems to capture the market’s current mood better than either straightforward bullishness or alarm.

Why record highs aren’t automatically a warning sign

Despite the instinct to treat repeated record closes as a sign a pullback is overdue, the historical pattern cited in the Yahoo Finance analysis suggests the opposite has generally been true: markets hitting new highs tend to reflect genuine earnings growth and sustained momentum rather than an unsustainable bubble on the verge of popping. That does not mean this cycle is immune to a correction — only that the mere fact of hitting record 27 has historically told investors less than the underlying earnings and rate trends driving it.

What happens next

With the index sitting just 0.7% below its all-time high, a fresh record close looks within reach barring a shock from the Treasury market or an escalation tied to Iran. Watch the 10-year and 30-year yields closely in the coming weeks: continued increases without a corresponding equity pullback would extend an already unusual pattern, while a sharper yield spike could finally be the catalyst that tests how much further growth stocks can run.

More business coverage

Related reading: last week’s broader market gains, the Federal Reserve’s latest rate decision, and AMD’s trillion-dollar valuation.

S&P 500 record highs questions answered

How did the S&P 500 perform the week of September 26, 2026?

It gained 1.2% for the week, closing roughly 0.7% below its all-time high, even as 10-year Treasury yields surged.

How many record highs has the S&P 500 set in 2026?

27 record closes through August 26, 2026, part of a year-to-date gain of roughly 13%.

What does history say happens after a record close?

From January 1988 through December 2023, the S&P 500 averaged a 13.4% gain in the 12 months following a record close, compared with an 11.9% average across all 12-month periods.

What sectors led this week’s gains?

Large-cap growth stocks, particularly the ‘Mag 7’ and broader technology sector, while smaller companies, REITs and commodities underperformed.

What risks are analysts watching?

The ongoing Iran conflict, elevated 30-year Treasury yields, and the possibility of further Federal Reserve rate increases, though none of these guarantee an imminent correction.

Sources

Why the World’s Top Oil Forecasters Just Got a Lot More Pessimistic

The IEA’s oil demand outlook has darkened sharply, with the agency’s September 2026 Oil Market Report now projecting world oil demand will decline by 2.5 million barrels per day (mb/d) in 2026 before recovering by 2.6 mb/d in 2027. The steeper-than-expected decline is attributed directly to what the agency calls “the continuing impasse in negotiations between the United States and Iran,” underscoring how much of the current global energy picture is being shaped by a single unresolved standoff rather than ordinary shifts in consumption.

Supply is falling too

It is not just demand forecasts moving. According to the IEA’s September 2026 report, global oil production fell to 100.1 mb/d in August 2026, down 1.6 mb/d from the prior month. Annual supply for 2026 is now forecast at 100.7 mb/d, a 5.7 mb/d decline year-over-year, though the agency expects production to rebound by roughly 8 mb/d in 2027 once current disruptions ease.

The Strait of Hormuz is the choke point

The report points to more than 10 mb/d of Gulf output remaining shut in because of heightened security risks. Net exports of diesel and gasoil from Gulf countries averaged just 390,000 barrels per day in August — a little over a quarter of pre-war levels — as flows through the Strait of Hormuz stayed severely constrained. The IEA also flags “renewed attacks” in both the Gulf and the Red Sea’s Bab el-Mandeb chokepoint as compounding the disruption, alongside separate losses to Russian refining capacity that are squeezing supply from another direction entirely.

OPEC’s view has been more cautious than alarmed

Earlier in the summer, OPEC’s own reporting still anticipated demand growth for 2026, even as it trimmed its forecast — from 780,000 bpd of growth projected in July down to 580,000 bpd by August — citing the same Hormuz-related disruption and stalled US-Iran talks the IEA has now folded into a full downward revision. The gap between OPEC’s continued (if reduced) growth call and the IEA’s outright decline forecast reflects how differently the two organizations are weighing the odds of the Strait reopening to something resembling normal flow in the near term.

Why the earlier assumptions broke down

Both organizations had previously built their models around a gradual restoration of oil flows through Hormuz as tensions eased. That assumption is now obsolete: the continued shut-in of Gulf output, renewed attacks along regional shipping routes, and the lack of any breakthrough in US-Iran negotiations have combined to keep the corridor operating at a fraction of its normal capacity for far longer than either forecaster initially modeled.

What happens next

Barring a genuine diplomatic breakthrough on Hormuz access or the broader US-Iran impasse, expect the IEA’s 2.5 mb/d demand decline and constrained supply picture to hold through the rest of 2026, with the agency’s projected 8 mb/d production rebound in 2027 contingent on exactly the kind of de-escalation that has so far failed to materialize. Energy-importing economies and shipping-dependent industries should plan for continued elevated freight and insurance costs on Gulf routes rather than a near-term return to pre-disruption flows.

More business coverage

Related reading: Iran aviation sanctions and flight disruptions, the recent Treasury yields bond rout, and the renewed Iran travel warning.

Oil demand outlook questions answered

How much is oil demand expected to fall in 2026?

The IEA’s September 2026 report projects world oil demand will decline by 2.5 million barrels per day in 2026, before recovering by 2.6 mb/d in 2027.

Why is demand falling so much?

The IEA attributes the steeper-than-expected decline directly to the continuing impasse in US-Iran negotiations and the resulting disruption to Gulf oil flows.

How much Gulf oil output is currently shut in?

More than 10 million barrels per day of Gulf output remains shut in due to heightened security risks around the Strait of Hormuz.

Does OPEC agree with the IEA’s outlook?

Not entirely. As of its August 2026 report, OPEC still expected demand growth, though it cut its forecast from 780,000 bpd of growth in July to 580,000 bpd, citing the same Hormuz disruption.

What happened to diesel and gasoil exports from the Gulf?

Net exports averaged just 390,000 barrels per day in August 2026, a little over a quarter of pre-war levels, as Strait of Hormuz flows stayed severely constrained.

Sources

Congress Bought Itself Until December 11 to Avoid a Shutdown

A US government funding bill signed into law this month has bought Congress breathing room until December 11, 2026, but it has not resolved the underlying gridlock over a full-year budget — and that unfinished business is what will define Washington’s next fiscal fight. The House passed the continuing resolution 370-48 on September 1, 2026, after the Senate had already cleared it in July on a lopsided 90-6 vote, sending it to the president’s desk with bipartisan margins that belie how little progress has actually been made on the twelve individual spending bills the stopgap was meant to buy time for.

What the stopgap actually does

The continuing resolution keeps federal funding at current levels through December 11, 2026, according to reporting from Government Executive. Beyond simply extending existing funding levels, the bill temporarily blocks a proposed Office of Management and Budget rule that would have subjected federal grants to political review, and it prevents the administration from transferring funds out of other programs to bolster Border Patrol funding — both provisions that Democrats had pushed for as a condition of their support.

The appropriations math that hasn’t changed

The stopgap’s real purpose was to buy time for Congress to pass a full slate of fiscal year 2027 spending bills, and that work remains far behind schedule. As of the bill’s passage, the House had passed only three of the twelve required appropriations bills, while the Senate had passed none, according to Nextgov/FCW’s coverage. House Speaker Mike Johnson said the extension lets lawmakers “avoid the threat” of a shutdown while work continues, and House Appropriations Chair Tom Cole acknowledged that the December deadline is “outpacing the work that remains” — an unusually blunt admission from the committee chair tasked with getting the bills done.

Why December 11 was chosen

The date is not arbitrary. It sits safely after the 2026 midterm elections, giving lawmakers room to negotiate a comprehensive spending package without a shutdown fight complicating campaign season. House leadership has indicated that the bulk of the substantive appropriations work will happen in November and December, once the political pressure of the election has passed — a familiar pattern in recent budget cycles, where election-adjacent deadlines get pushed just past the vote itself.

What a shutdown would still cost

Because only a quarter of the required spending bills have cleared the House and none have cleared the Senate, the risk of a funding lapse in December has not gone away — it has simply been deferred. Federal agencies, contractors and the millions of federal employees whose pay depends on appropriations moving on time are effectively on a two-and-a-half month grace period, with the same partisan disagreements over spending levels, policy riders and the blocked OMB grants rule still unresolved underneath the calm.

What happens next

Watch for appropriations activity to pick up through November as the December 11 deadline approaches, with the blocked OMB grants-review rule and Border Patrol funding transfer restrictions likely to resurface as sticking points in the full-year negotiations. If the twelve individual bills remain stalled by early December, expect another short-term stopgap rather than a shutdown, given the wide bipartisan margins that passed this one.

More business coverage

Related reading: the Federal Reserve’s latest rate decision, the recent Treasury yields bond rout, and the Swiss National Bank’s policy decision.

US funding bill questions answered

How long does the stopgap bill fund the government?

Through December 11, 2026, at current funding levels, after the House passed it 370-48 on September 1, 2026 and the Senate had already passed it 90-6 in July.

What does the bill block?

It temporarily blocks a proposed OMB rule that would subject federal grants to political review, and it prevents the administration from transferring funds from other programs to Border Patrol.

How much of the FY2027 budget is actually done?

Very little. As of the bill’s passage, the House had passed only 3 of the 12 required appropriations bills, and the Senate had passed none.

Why was December 11 chosen as the deadline?

It falls after the 2026 midterm elections, giving lawmakers room to negotiate a full spending package without a shutdown fight overlapping campaign season.

Could there still be a shutdown in December?

It’s possible, since most appropriations work remains unfinished, but given the wide bipartisan margins on this stopgap, another short-term extension is seen as more likely than a lapse.

Sources